Every time you visit WeatherEarth in your favorite browser, a 3D virtual globe is shown. If location service is granted, WeatherEarth will automatically detect your geographic position and properly set the map scale and offset so that your country is shown at the center of browser window with an appropriate zoom scale. However, you may navigate to a particular region of interested by zooming and rotating (translating respectively) in 3-D (2-D respectively).
The gestures to navigate the scene differ for desktop and mobile browsers.
|
|
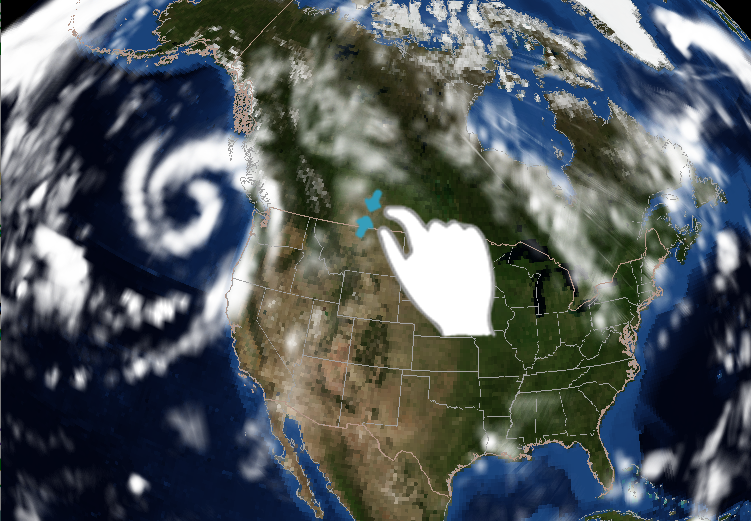
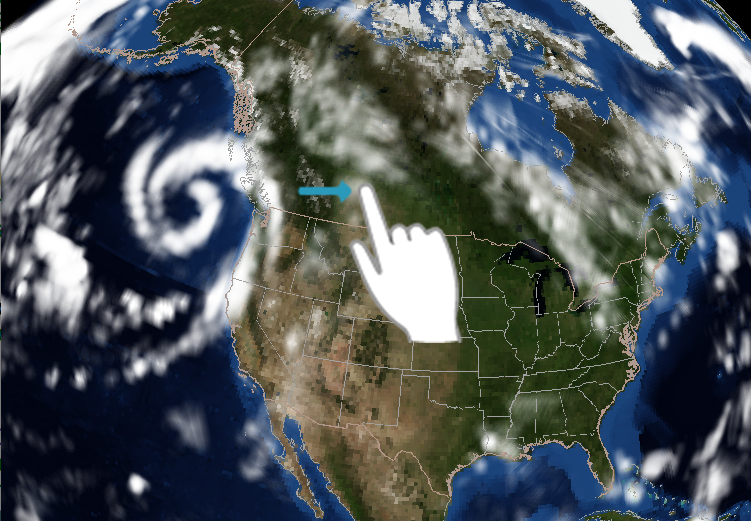
| For mobile browsers, users may use familiar gestures like pinch and stretch to zoom (left), and slide to rotate (right) the scene. | |
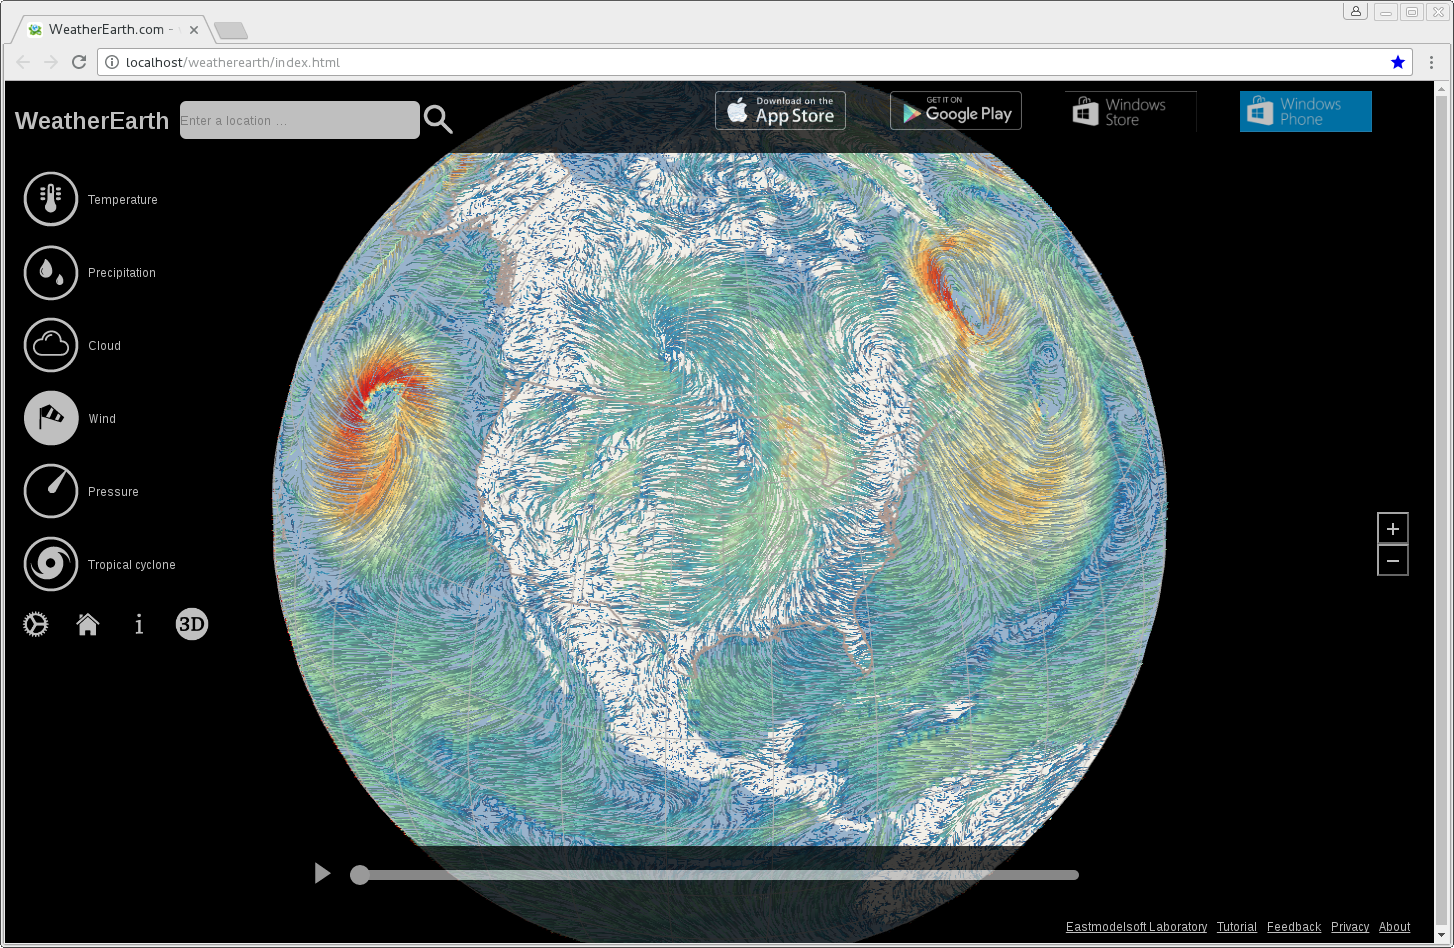
The on-screen zoom control shown in the figure below provide an alternative way to zoom the scene. Users may tap the plus sign (minor sign respectively) to zoom in (out respectively).
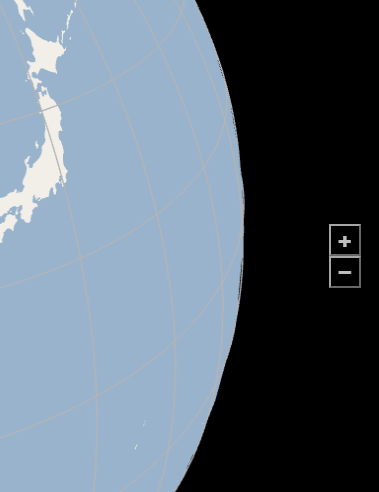 |
| The zoom controls on the right of browser window provide an alternative way to zoom the scene. |
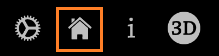 |
| Home button lets users return to the default view. |
 |
| View dimension button lets users toggle between 3-D and 2-D view. |
 |
| The forecast panel. |
You may change your favorite location by pressing the location name. A popup window will be displayed and you can select a different location from the list. To help users quickly find location of interested, a search control is provided on the top of the list. For example, if a user types "united sta", only cities of United States are listed. Users may also sort the city list either city name or country name. The popup window can be dismissed either after you make a selection from the list or tapping anywhere outside the window.
 |
 |
| The popup window. | Use the search control to narrow down the search range. |
1, Air temperature at 2 meters above the ground (unit: ° C);
2, Cumulative surface precipitation that fell within previous 6 hours (unit: millimeter);
3, Cloud water mix ratio in the entire atmosphere, which indicates cloud structure and level of coverage;
4, Wind flow at 10 meters above the ground (unit: meters per second);
5, Air pressure converted to the mean sea level (unit: hundred Pa).
6, Tropical cyclone tracks.
To view one of these six weather elements, just tap the corresponding button in the settings window. In WeatherEarth, a graphics representation of a whether element is called a layer. We will use the term layer hereafter to refer to corresponding graphics representation of weather element for the sake of simplicity.
When WeatherEarth is initially launched, no layers are created. A user can create a layer by tapping the corresponding button in the settings window. WeatherEarth shows a progress bar at the top of browser window to indicate the download progress. After a layer is successfully generated, its corresponding button will be highlighted. Tapping a highlighted button will make the button back to the normal state and hide (but not remove) the corresponding layer. Tapping a button in normal state will either creating a new layer if the corresponding layer has not been created or needs to be updated, or showing the hidden layer if the corresponding layer has been created and then hidden.
 |
| This figure shows the wind layer with its button being drawn in highlighted state. |
The table below provides a summarization of the supported weather elements.
| weather element | toolbar button | graphics representation description |
|---|---|---|
| Air temperature | 
| Air temperature is represented as filled contours where warm colors denoting large data values and cold colors small data values. |
| Cumulative precipitation | 
| Cumulative precipitation is also plotted as filled contours. Contrary to air temperature, precipitation contours only cover part of the world surface. |
| Cloud | 
| Cloud is drawn as a three-dimensional semi-transparent volume. |
| Wind flow | 
| Wind flow is displayed using particle animation where the motion trajectory representing wind direction and particle color representing wind velocity. |
| Air pressure | 
| Air pressure is drawn as isopleth in which a curve connecting points with the same numerical values with one or more labels on it representing the value. |
| Tropical cyclones | 
| A tropical cyclone is drawn as a series of low-pressure centers connected with a line strip representing the track this cyclone moves along. |
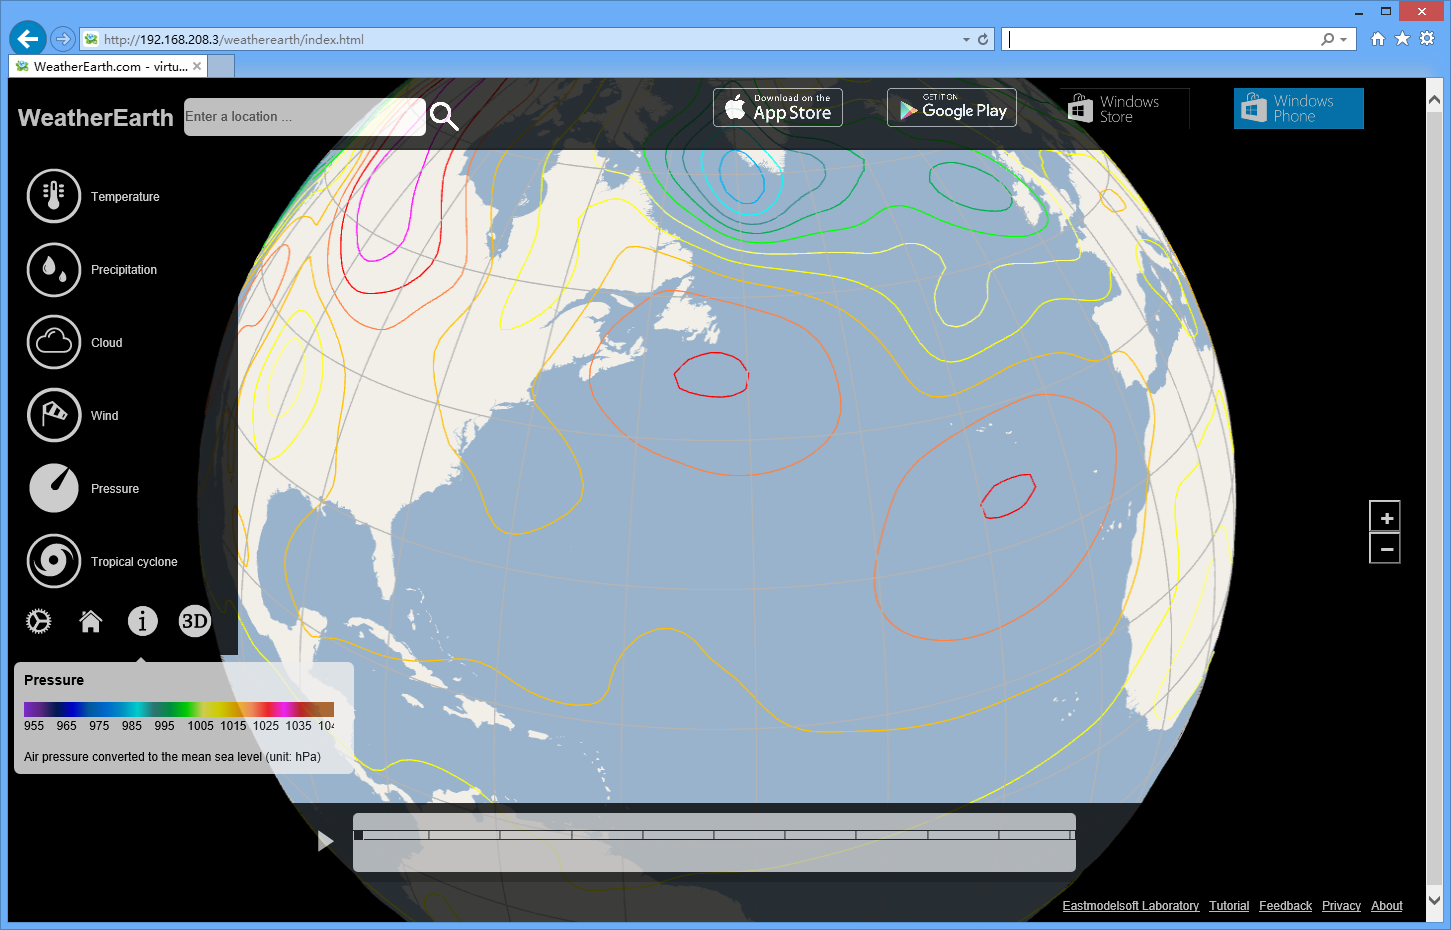 |
| This figure shows a pressure layer along with its detailed information including layer description and a color bar. |
 |
| Tapping the "Settings" button brings out the popup "Options" window on the left side of the screen, in which users may do customizations. |
In this window, users may do the following customizations:
When Show Geographic Position at Pointer is selected, the value of longitude, latitude and altitude corresponding to the input device pointer is shown at the bottom of application window.
Choose the Show Terrain switch to show the world terrain.
Choose the Show Satellite imagery switch to show NASA's Blue Marble satellite imagery.
Select the Show Country Borders switch to view world administration boundaries.
Use the Show Graticules switch to show or hide longitude and latitude lines.
Toggle with the Show Map Scale switch to show or hide map scale.
Turn on Keep Meridian Upright switch to keep meridian circles always being vertical during scene navigation.
Switch on the Show Benchmark switch will show frame per seconds (FPSs) values on the screen. You can use WeatherEarth Web as a benchmarking tool to evaluate the performance of your browsers
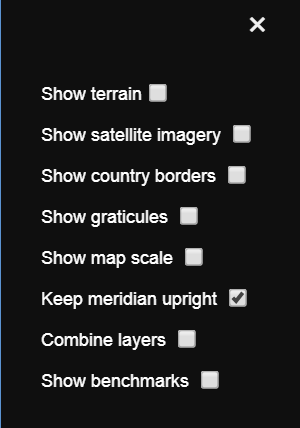 |
| The "Options" window allows users to customize the way they use the application. |
In addition to the settings provided in the "Options" window, users may find more details about the application by following the links at the bottom of the window. Tap the "Tutorial" item brings you to this document. You may provide us your valuable suggestions or submit bugs by selecting "Feedback" item. Other options include privacy statement and version information.